


Median session length for 48 clinical specialties, from live recordings captured by Twofold's ambient scribe across 6,989 clinicians over six months. Twelve talk‑therapy professions converge on 51 to 57 minutes. Psychiatry runs 17.4, family medicine 12.1.
Findings
- Across 652,932 recorded sessions, all twelve talk-therapy professions land between 51.2 and 57.4 minutes median. The 50-minute hour holds. The four largest professions, 572,532 sessions between them, sit inside a single minute: 53.8 to 54.7.
- Ten of twelve therapy professions have a median session within two minutes of the 53-minute threshold where CPT 90837 begins paying 15 to 25 percent more. At the other boundary, five professions' 25th percentiles land between 38.6 and 39.4 minutes, on the 38-minute floor of the lower code, 90834.
- The median psychiatry visit is 17.4 minutes across 226,000 sessions: one third of a therapy session, inside the same field of mental health. Its middle 50 percent spans 8.9 to 30.4 minutes, the widest relative spread of any large specialty.
- The median family-medicine visit contains 12.1 minutes of recorded conversation; urgent care, 5.1. Internal medicine runs 13.2 and pediatrics 10.2. Time-use surveys report 18 to 20 minutes face-to-face; the difference is the silent exam.
- Lactation consultants log the longest visits of all 48 specialties: 65 minutes median, above every form of psychotherapy measured. 2,508 sessions from 34 clinicians; the longest talk therapy, trauma therapy, tops out at 57.4.
The 50-minute therapy hour, measured across 652,932 sessions
The 50‑minute hour began as a psychoanalytic convention: a full hour on the books, ten minutes reserved for the note. Nobody could say whether clinicians keep it, because nobody was timing the sessions. An ambient scribe times them incidentally: it listens during the visit to draft the clinical note, and the session's length falls out as a by‑product.
We split every talk‑therapy profession and measured each separately. Different training, licensure, client populations. The medians:
Profession | Median (min) | vs 53 | Middle 50% (min) | Sessions | Clinicians |
|---|---|---|---|---|---|
Trauma Therapy | 57.4 | +4.4 | 51.7 to 62.2 | 1,581 | 13 |
Family Therapy | 55.8 | +2.8 | 47.1 to 61.9 | 2,317 | 18 |
Marriage and Family Therapy | 54.7 | +1.7 | 47.9 to 60.0 | 41,461 | 192 |
Mental Health Counseling | 54.6 | +1.6 | 47.0 to 59.9 | 232,219 | 1,491 |
Psychotherapy | 53.9 | +0.9 | 45.1 to 59.6 | 186,601 | 1,349 |
Clinical Social Work | 53.8 | +0.8 | 43.6 to 59.5 | 112,251 | 703 |
Social Work | 53.3 | +0.3 | 39.3 to 60.5 | 18,241 | 106 |
Clinical Psychology | 52.7 | -0.3 | 38.8 to 58.7 | 27,098 | 104 |
Behavioral Health Counseling | 51.9 | -1.1 | 41.2 to 58.5 | 16,007 | 85 |
Behavioral Therapy | 51.7 | -1.3 | 39.4 to 59.6 | 3,217 | 47 |
Psychology | 51.6 | -1.4 | 38.7 to 58.3 | 1,000 | 19 |
Cognitive Behavioral Therapy | 51.2 | -1.8 | 38.6 to 57.3 | 10,939 | 46 |
The four largest professions, 572,532 sessions, sit between 53.8 and 54.7. For most rows the middle 50 percent falls inside 44 to 60 minutes. The hour bends; it rarely breaks.
The 53-minute line: therapy medians cluster at a billing threshold
Something sits exactly at 53 minutes, and it is not a psychoanalytic convention. It is a price change.
Outpatient psychotherapy is billed in time bands with hard edges:
Code | Face-to-face time | Reimbursement |
|---|---|---|
90832 | 16 to 37 min | base |
90834 | 38 to 52 min | mid |
90837 | 53 min and up | 15 to 25% above 90834 — roughly $30 to $35 more on Medicare |
The 53‑minute figure is not clinical. It is the AMA's midpoint between the 45‑minute target of 90834 and the 60‑minute target of 90837 — 52.5, rounded up. A 52‑minute session is 90834. A 53‑minute session is 90837. No rounding, and payers audit the boundary.
Now place the twelve medians against those bands:
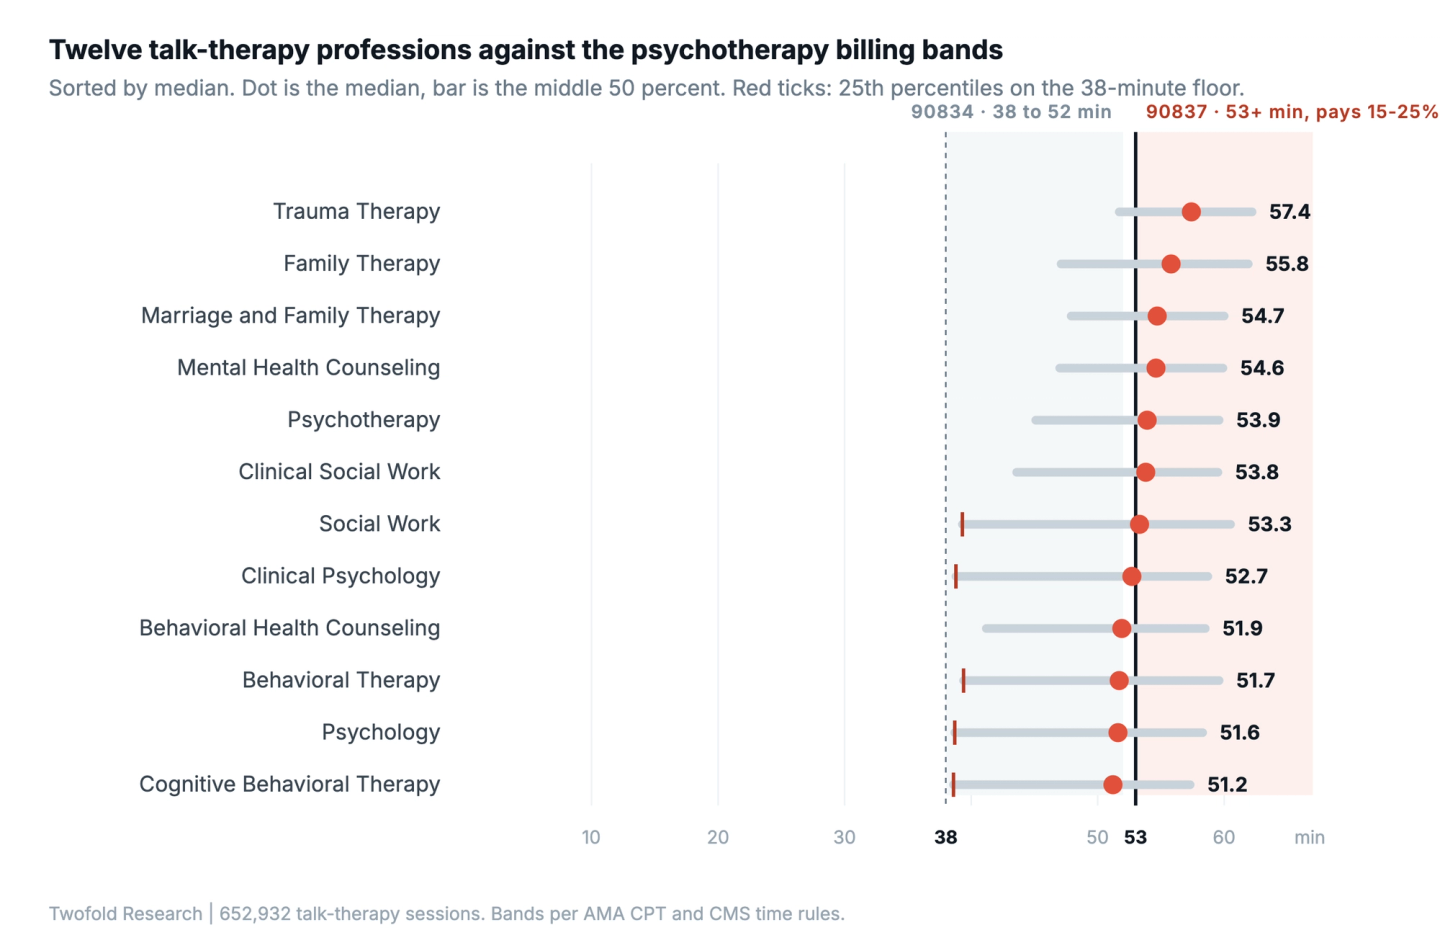
Two boundaries, two clusters. Medians pile up at the 53‑minute threshold where payment steps up; five 25th percentiles pile up at the 38‑minute floor below which the session falls to the lower code (clinical psychology 38.8, CBT 38.6, psychology 38.7, social work 39.3, behavioral therapy 39.4). Both are visible in quartiles alone; neither needs a model.
There is already one argument against the billing story inside this dataset. Physical, occupational and speech therapy bill under the CMS 8‑minute rule, whose unit steps fall at 23, 38 and 53 minutes. If thresholds pulled duration upward everywhere, physical therapy would sit just above 53. It sits at 50.3, mid‑band. Whatever happens at 53 in psychotherapy is not a universal law of threshold‑seeking.
Psychiatry runs on two clocks: short med checks, long evaluations
If the therapy hour is a contract, psychiatry never signed it. It sits inside mental health, and its median is 17.4 minutes across 226,000 sessions from 1,001 clinicians. Most outpatient psychiatry is medication management, and medication management is a decision, not a conversation.
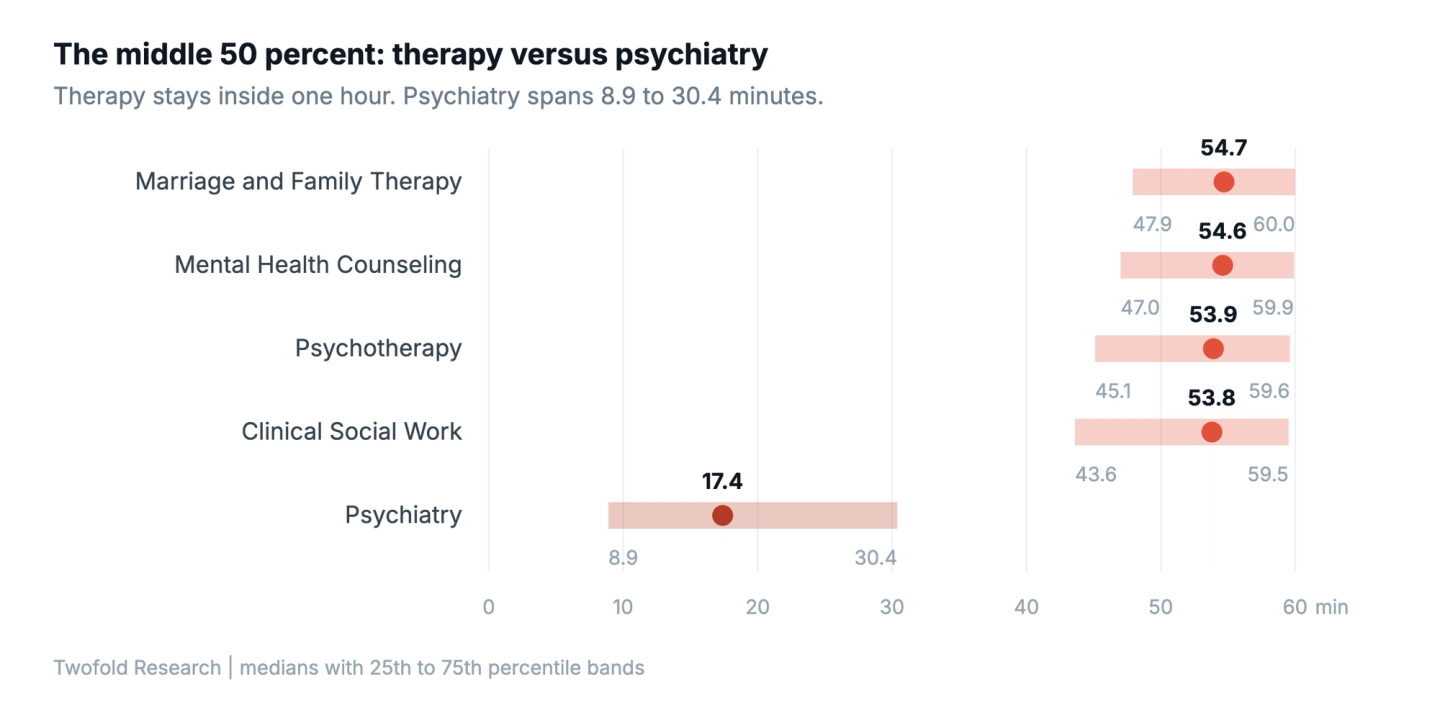
The mean is 22.7 against a median of 17.4: many short visits plus a long tail of intakes and evaluations. Two visit types sharing one label. Strictly, mean above median with a wide IQR is also consistent with plain right skew; the histogram will confirm the two clocks or kill them.
The 12-minute doctor visit, and why surveys say 18 to 20
Nobody is surprised that the doctor's visit runs short; patients have complained about it for decades. The complaint now has a number. The median recorded family‑medicine visit is 12.1 minutes, internal medicine 13.2, pediatrics 10.2, urgent care 5.1. Time‑use surveys put primary‑care face‑to‑face time nearer 18 to 20 minutes, and the gap is not an error on either side. It is the definition.
Every medical specialty here shows a mean well above its median (family medicine 16.1 against 12.1): most visits are quick, a minority run long. The 15‑minute slot survives because typical visits finish under it and complicated ones borrow the difference.
Conversation-bound versus decision-bound: the split that predicts session length
Rank all 48 specialties on one axis and the mental‑versus‑medical framing falls apart. Physical therapy runs 50.3, four minutes off psychotherapy. Occupational therapy 44.8. The longest sessions belong to lactation consultants at 65.
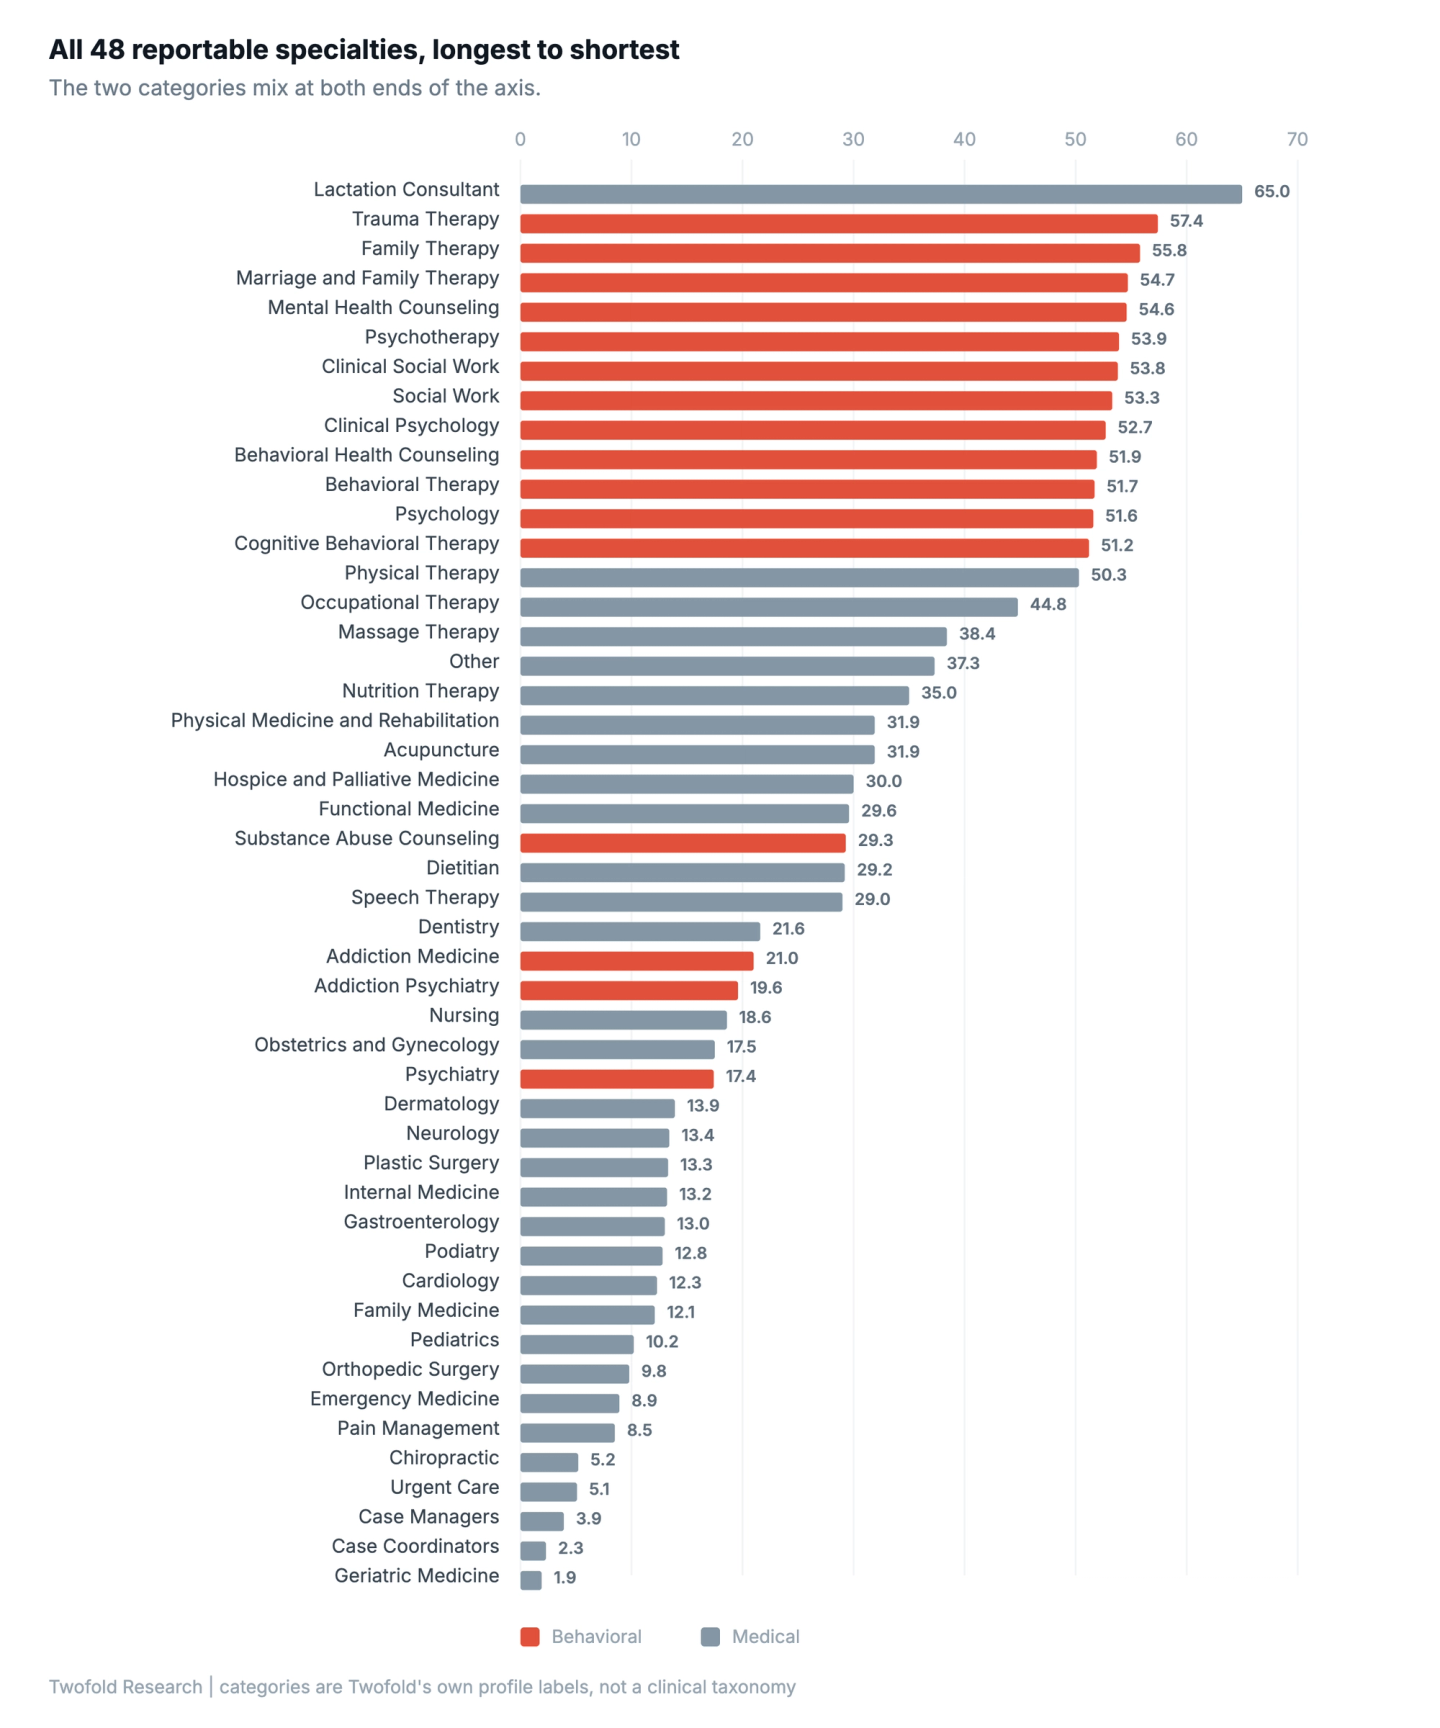
Lactation consulting is filed as Medical and is the longest thing we can see; psychiatry is filed as Behavioral and sits nearer urgent care than therapy. The labels are profile fields, not a taxonomy, and they are the wrong axis.
Failure modes: five ways this data can mislead
Every claim above depends on one instrument. These are the five ways it can mislead, in order of how much they worry us.
Not done yet, in order: telehealth versus in‑person split; exclusion counts at the 1‑minute and 4‑hour bounds; clinician‑level medians and between‑clinician variance; confidence intervals; and the minute‑level histogram, which is running now and gets published either way.
Method: how 1,116,796 sessions were measured
Duration here is the actual length of the recorded encounter, captured as a by‑product of drafting the note. Not a self‑report, not a billing increment, not a documentation timestamp.
Parameter | Value |
|---|---|
Window | Six months ending July 2026 |
Sessions | 1,116,796 live conversation captures |
Clinicians | 6,989 |
Included | Completed, non-deleted live captures only |
Excluded | Dictation and typed notes (no meaningful duration) |
Bounds | 1 minute to 4 hours (drops accidental taps, runaway recordings) |
Estimator | Median and IQR via percentile_cont, linear interpolation |
Suppression | Under 500 sessions or under 10 clinicians |
Specialty | Clinician self-reported profile field |
Privacy | Aggregate start/end times only; audio discarded after drafting; no training on patient data |
The full dataset: all 48 specialties
Every specialty that passed the thresholds, ranked by volume, including the rows that complicate the story.
Specialty | Category | Sessions | Clinicians | Sessions / clinician | Median (min) | Middle 50% (min) |
|---|---|---|---|---|---|---|
Mental Health Counseling | Behavioral | 232,219 | 1,491 | 156 | 54.6 | 47.0 to 59.9 |
Psychiatry | Behavioral | 226,000 | 1,001 | 226 | 17.4 | 8.9 to 30.4 |
Psychotherapy | Behavioral | 186,601 | 1,349 | 138 | 53.9 | 45.1 to 59.6 |
Clinical Social Work | Behavioral | 112,251 | 703 | 160 | 53.8 | 43.6 to 59.5 |
Family Medicine | Medical | 46,501 | 332 | 140 | 12.1 | 6.1 to 21.3 |
Marriage and Family Therapy | Behavioral | 41,461 | 192 | 216 | 54.7 | 47.9 to 60.0 |
Clinical Psychology | Behavioral | 27,098 | 104 | 261 | 52.7 | 38.8 to 58.7 |
Physical Therapy | Medical | 23,637 | 183 | 129 | 50.3 | 32.8 to 58.6 |
Social Work | Behavioral | 18,241 | 106 | 172 | 53.3 | 39.3 to 60.5 |
Behavioral Health Counseling | Behavioral | 16,007 | 85 | 188 | 51.9 | 41.2 to 58.5 |
Geriatric Medicine | Medical | 13,722 | 27 | 508 | 1.9 | 1.3 to 3.6 |
Internal Medicine | Medical | 12,624 | 109 | 116 | 13.2 | 7.0 to 21.8 |
Podiatry | Medical | 11,185 | 25 | 447 | 12.8 | 6.0 to 23.0 |
Cognitive Behavioral Therapy | Behavioral | 10,939 | 46 | 238 | 51.2 | 38.6 to 57.3 |
Chiropractic | Medical | 9,901 | 39 | 254 | 5.2 | 2.4 to 11.3 |
Pain Management | Medical | 5,461 | 23 | 237 | 8.5 | 5.6 to 13.1 |
Speech Therapy | Medical | 5,386 | 70 | 77 | 29.0 | 22.1 to 38.6 |
Dietitian | Medical | 5,130 | 58 | 88 | 29.2 | 8.9 to 52.0 |
Substance Abuse Counseling | Behavioral | 4,231 | 52 | 81 | 29.3 | 14.0 to 46.9 |
Functional Medicine | Medical | 4,018 | 31 | 130 | 29.6 | 18.5 to 46.7 |
Pediatrics | Medical | 4,005 | 48 | 83 | 10.2 | 5.9 to 16.6 |
Gastroenterology | Medical | 3,709 | 13 | 285 | 13.0 | 8.4 to 19.0 |
Nutrition Therapy | Medical | 3,586 | 30 | 120 | 35.0 | 22.5 to 50.5 |
Behavioral Therapy | Behavioral | 3,217 | 47 | 68 | 51.7 | 39.4 to 59.6 |
Occupational Therapy | Medical | 2,969 | 70 | 42 | 44.8 | 24.6 to 59.6 |
Case Managers | Medical | 2,895 | 68 | 43 | 3.9 | 1.6 to 23.1 |
Dentistry | Medical | 2,509 | 27 | 93 | 21.6 | 9.8 to 36.7 |
Lactation Consultant | Medical | 2,508 | 34 | 74 | 65.0 | 46.0 to 88.0 |
Neurology | Medical | 2,490 | 15 | 166 | 13.4 | 7.6 to 20.9 |
Addiction Medicine | Behavioral | 2,486 | 27 | 92 | 21.0 | 9.2 to 40.2 |
Urgent Care | Medical | 2,413 | 11 | 219 | 5.1 | 3.3 to 7.8 |
Family Therapy | Behavioral | 2,317 | 18 | 129 | 55.8 | 47.1 to 61.9 |
Addiction Psychiatry | Behavioral | 2,117 | 13 | 163 | 19.6 | 11.1 to 30.7 |
Orthopedic Surgery | Medical | 2,040 | 29 | 70 | 9.8 | 6.4 to 15.1 |
Other | Medical | 1,888 | 35 | 54 | 37.3 | 13.4 to 57.4 |
Physical Medicine and Rehabilitation | Medical | 1,866 | 17 | 110 | 31.9 | 19.3 to 38.3 |
Plastic Surgery | Medical | 1,848 | 12 | 154 | 13.3 | 6.1 to 23.2 |
Obstetrics and Gynecology | Medical | 1,672 | 14 | 119 | 17.5 | 9.3 to 40.8 |
Dermatology | Medical | 1,605 | 10 | 160 | 13.9 | 7.9 to 22.1 |
Trauma Therapy | Behavioral | 1,581 | 13 | 122 | 57.4 | 51.7 to 62.2 |
Emergency Medicine | Medical | 1,247 | 27 | 46 | 8.9 | 5.8 to 12.5 |
Nursing | Medical | 1,214 | 45 | 27 | 18.6 | 3.9 to 34.2 |
Psychology | Behavioral | 1,000 | 19 | 53 | 51.6 | 38.7 to 58.3 |
Massage Therapy | Medical | 811 | 16 | 51 | 38.4 | 4.0 to 58.3 |
Cardiology | Medical | 628 | 16 | 39 | 12.3 | 8.3 to 18.6 |
Acupuncture | Medical | 626 | 13 | 48 | 31.9 | 19.1 to 52.8 |
Hospice and Palliative Medicine | Medical | 566 | 12 | 47 | 30.0 | 17.7 to 48.5 |
Case Coordinators | Medical | 516 | 19 | 27 | 2.3 | 1.4 to 4.7 |
Take it. Specialty‑level aggregates, CC BY 4.0, attribution to Twofold Research: session-length-by-specialty-2026.csv.
Why we have this data
Twofold is an ambient AI scribe: it listens during the visit and drafts the clinical note in the clinician's format, so session length is documentation exhaust. Audio is discarded once the note is drafted and no model is trained on patient data. If you would rather spend the 54 minutes on the client than the note, that is the product.
Questions about the data: info@trytwofold.com